
Artifacts from everyday UX adventures
There's always something going on along the sidelines of larger projects like the ones I've shared on this site, and many more conceptual, half-baked or top secret projects that can’t be shared. Even in strictly management roles, there’s always UX artifacts under way behind the scenes.
Storyboard / wire flows
Customer journey mapping
Alignment & collaboration resources
Hands-on wireframes
UX evaluation framework (heuristics)
System diagrams
Account management UX
Conversation mapping

Story flows for early product exploration
I often explore use cases with a combination of storyboarding and wire-framing to dive deeper into possible scenarios and solutions with an experience design lens. This example is from some early product exploration around mobile data consumption. The team wanted to design “mobile first” but were unclear what scenarios to support or how best to use the mobile form factor to augment the current desktop experience.
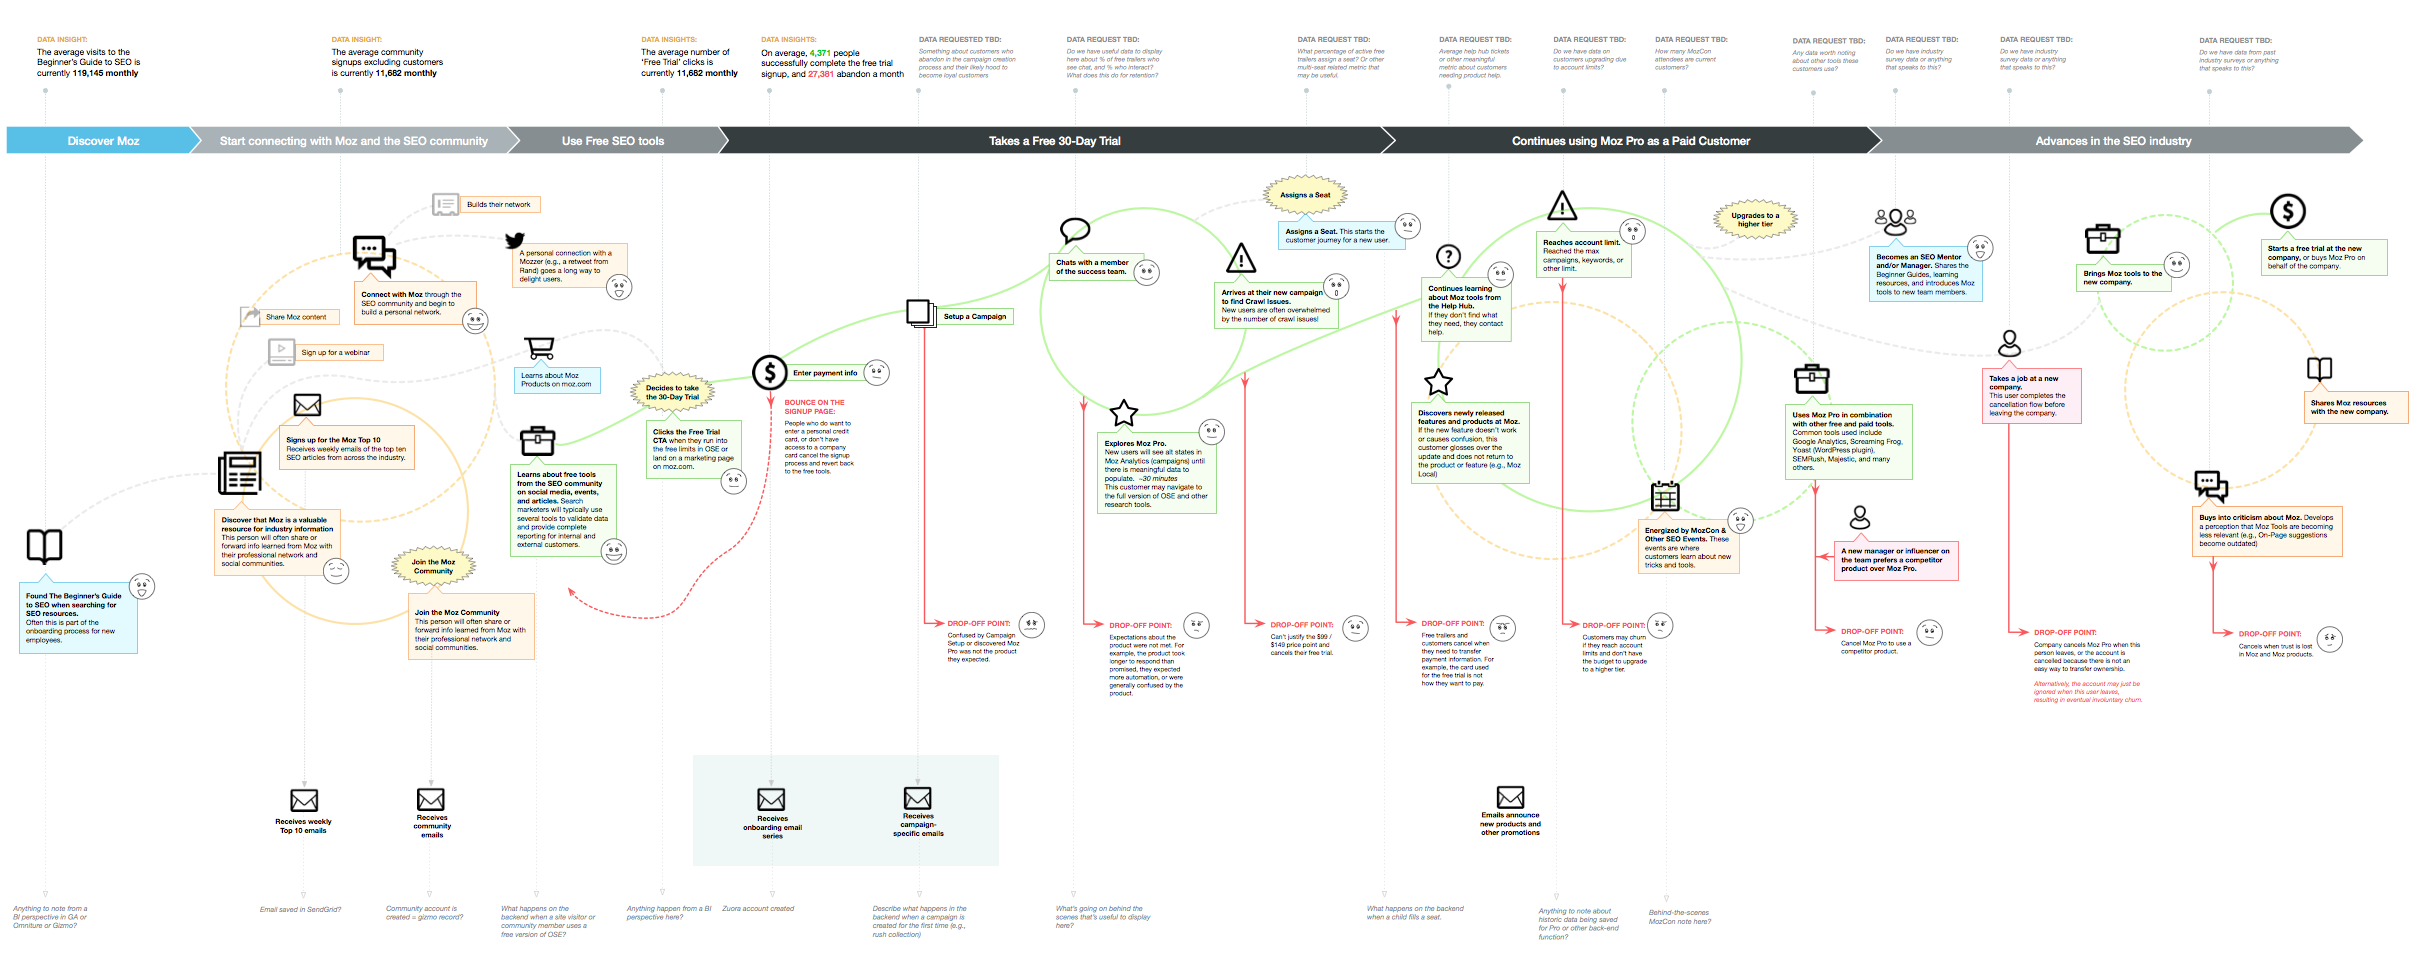
Customer journey map for end-to-end experience design
I created a customer journey map to explain the end-to-end customer experience, opportunities for improvement, supported internal systems, and layer related metrics. We used this document as a tool to align teams, prioritize issues and opportunities, frame quantitative and qualitative data, and build deeper awareness and empathy for our customers. I created the map in OmniGraffle as a template that others could populate and update over time.
I worked with UX researcher and project lead, Jackie Magwire.

Hands-on wireframing for a quick dashboard re-design
New customers were churning out before the end of their free 30-day trial. We knew the dashboard was our best opportunity to show value sooner, but it could take days or weeks for customer data to be available. We leveraged usage data to inform changes that would reduce complexity and enable a better experience.
I took a hands-on approach to the UX process, and cut my wireframes apart to communicate dependancies and variables with the product team. We landed on a modular system with logic to evolve as the customer interacted with the product. The system designed has stood up to product growth for 2+ years and counting.
I partnered closely with the product manager, Jon White.


Alignment & collaboration tools
I like to use Google docs or stickies or anything that facilitates discussion and collaboration to build alignment and understanding. When we know how our work connects, we can better design holistic solutions that compliment one another. When we have a voice in how we work together, and adjust as needed, we have more trust in the process and each other for better outcomes and experiences along the way.

Vision design concepts for strategic discussions and roadmap planning
This Keynote highlights product concepts for the Employee XM 2020 vision. I designed these prototypes in Figma and animated them in Keynote, so that they could be shared by business leaders in their own presentations as needed. This is just one of many vision design exercises I have led or contributed to in my lead and manager roles.
Conceptual work like this is always confidential and aspirational. Once validated and prioritized, these ideas materialize as product improvements and new features in quarters ahead.
UX evaluation framework to measure and improve
I created a template for evaluating the user experience of our products based on Jacob Neilson's 10 Usability Heuristics for User Interface Design. The purpose was to provide an objective way to evaluate the user experience of a product or website site. Someone other than the product's designer would rate the product by each heuristic (e.g., "Every page (or display) begins with a title or header that describes screen contents clearly and consistently") by answering usually, always, sometimes, rarely, or never. A score is generated based on the results. The first evaluation serves as a benchmark. The experiences were to be re-evaluated quarterly to measure UX improvements objectively. View example evaluation
Contributors: Lisa Wildwood, Christian Manzella, and the UX team at Moz in 2015/2016


System diagram to communicate opportunities and constraints
I worked with an engineering lead to understand and articulate the technical systems supporting key functions relating to acquisition, retention, and subscription management. While learning a ton about the infrastructure myself, the primary audience for this diagram was business owners from marketing and product teams. The idea was to create shared understanding of the technical environment to better communicate dependancies, opportunities, and limitations before planning and scoping new work.
Engineer Devin Ellis worked with me to understand and explain the relationships.

Conversation map for cohesive UX
I this idea of a conversation map that I first learned from Steph Hay. The technique worked particularly well for a Moz subscription management project that had many starts and stops and many more cross-team dependancies. All scenarios were captured in a Google doc, an easy place to discuss anything UX-impacting from messaging needs to technical limitations.